FJ Solutions
The Ultimate Guide to CLV to CAC Ratio: How to Measure, Optimize, and Scale Profitably in 2026
10 min read
Table of contents
- Introduction
- What Is t CLV to CAC Ratio?
- How to Calculate the CLV to CAC Ratio (Step by Step)
- What Is a Good CLV to CAC Ratio?
- Why the CLV to CAC Ratio Is Critical for Business Decisions
- How to Improve Your CLV to CAC Ratio
- Common Mistakes When Measuring CLV/CAC
- How to Track CLV/CAC in 2026
- CLV to CAC Ratio FAQs
Introduction
A few years ago, we started working with an ecommerce brand in the women’s fashion space (CBD brand for women).
They were running paid ads, getting traffic, making sales… from the outside, it looked like things were working. But when we sat down and ran the numbers, the picture was very different.
Their Customer Acquisition Cost (CAC) was $873 per new customer. Their Customer Lifetime Value (CLV) was $755.
That means their CLV to CAC ratio was 0.86… so, for every dollar they spent acquiring a customer, they were getting back less than 87 cents :(
They were losing money on every single sale… and the faster they grew, the faster they bled!!
Obviously, the store is no longer online.
This is not a rare story. It happens to ecommerce brands every day, not because they had a bad product, or a bad team, but because they never stopped to ask the most important question in business:
What is a customer actually worth to us, and what are we paying to get one?
This is what the CLV to CAC ratio answers.
It is one of the most important metrics any ecommerce business can track (besides CLV, CAC, ROAS by channel, blended profit margin, and overall acquisition efficiency).
None of these metrics tell the full story on their own. But the CLV/CAC ratio is unique because it puts cost and value in direct conversation with each other, giving you a single number that reflects the long-term health of your business model.
Let’s start to dig in!
What Is the CLV to CAC Ratio?
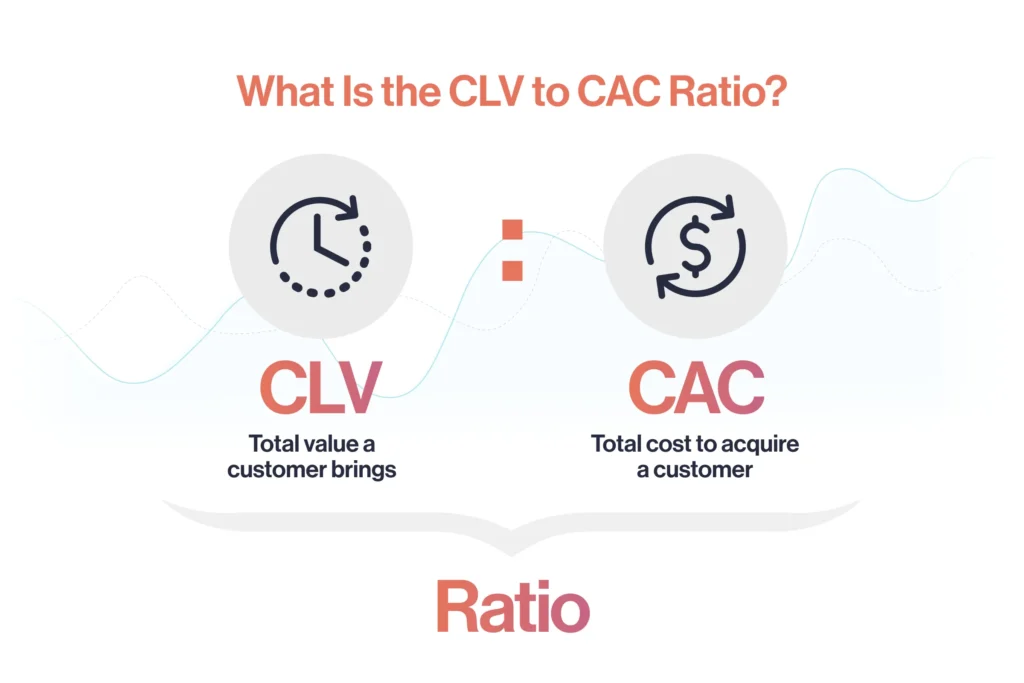
The CLV to CAC ratio is how much does it cost us to win a customer… and how much is that customer actually worth.
It’s that simple.
Two numbers, one ratio, and an enormous amount of information packed into it.
The formula itself is simple:
Customer Lifetime Value (CLV) / Customer Acquisition Cost (CAC)
The result tells you whether your business model is working… not just whether you’re making sales.
What makes it so valuable compared to other metrics?
ROAS tells you how your ads performed.
CPL tells you what you’re paying per lead.
AOV shows your average order size.
All useful, for sure… but none of them tell you whether the customer you just acquired is actually going to be profitable over time.
The CLV/CAC ratio does.
It connects the cost of getting a customer to the value that customer brings, giving you a true picture of your business health and your real capacity to scale.
What Is Customer Lifetime Value (CLV)?
Customer Lifetime Value (CLV) is the total net revenue your ecommerce can expect to earn from a single customer throughout the entire duration of their relationship with your brand.
In our more than 25 years of ecommerce experience, I’ve simplified the formula and made it available to everyone.
Read our full article about CLV and our free CLV calculator
What Is Customer Acquisition Cost (CAC)?
Customer Acquisition Cost (CAC) is how much you pay, in total, to acquire a single new customer.
And when I say total, I mean it, not just your ad spend.
In my experience, most of the ecommerce owners only look at what they spend on Google or Meta ads and call that their CAC.
That’s one of the most common and costly mistakes I see.
Your real CAC includes everything that goes into bringing a new customer through the door: paid ads, yes, but also your social media team or agency, your SEO investment, your email marketing platform, your developers, your designers, your operations and project management costs, and any sales tools or software you’re running.
Add all of that up, divide by the number of new customers you acquired in the same period, and you have your true CAC.
Read our full article CAC and our free CAC calculator.
How CLV and CAC Work Together
Think of CLV and CAC as two sides of the same coin.
One without the other is incomplete.
CAC tells you what you paid. CLV tells you what you got.
The ratio between them tells you if the trade was worth making… and whether you can afford to keep making it as you grow.
A business with a strong CLV can afford a higher CAC and still scale profitably.
A business with a low CLV needs to be laser-focused on cutting acquisition costs just to survive.
In my experience, the CLV/CAC ratio is also one of the best early-warning systems available.
When it starts dropping (even before you’re feeling the pressure in cash flow) it’s telling you something is off: your acquisition costs are climbing, your retention is slipping, or both.
Track it every month, and it becomes a dashboard for the long-term health of your store.
That’s why I always recommend setting an alert when your CLV:CAC ratio drops below 3… that’s your signal to act before the problem becomes serious.
Put simply: you can run a profitable business without tracking your CLV/CAC ratio… but you can’t scale without it.
How to Calculate the CLV to CAC Ratio (Step by Step)
There are four numbers you need:
- your CLV,
- your CAC,
- the ratio itself,
- and (once you have those) your payback period.
We’ll go through each one using the same formulas we use with our own clients.
How to Calculate Your CLV
After more than 25 years working with ecommerce brands across Shopify, Magento, WooCommerce, and others, this is the formula I trust…
And the one that consistently produces actionable results:
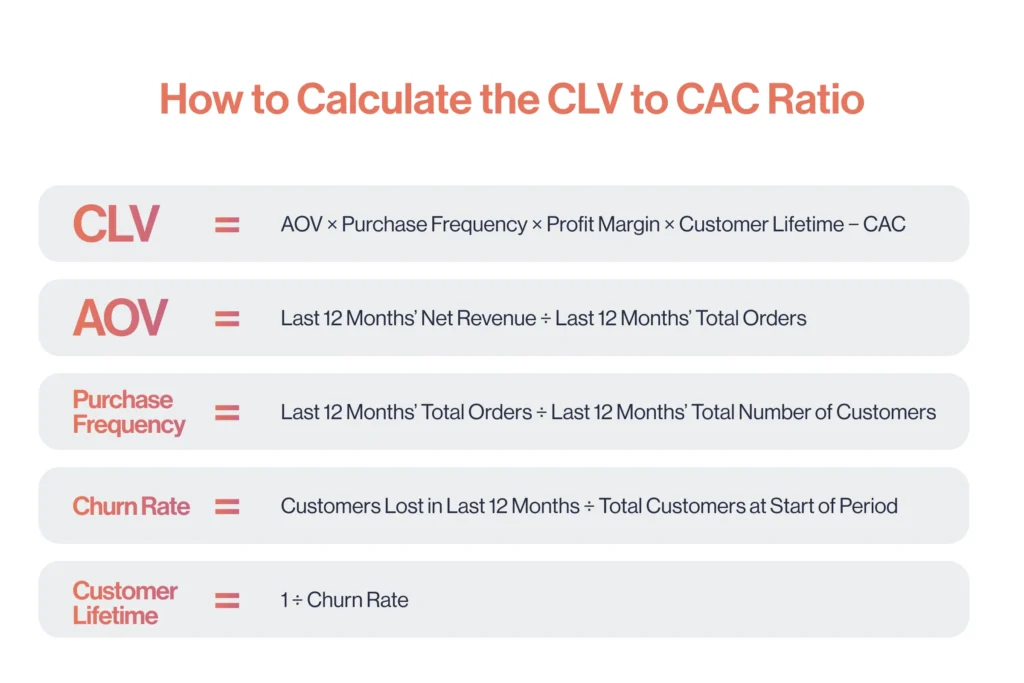
CLV = AOV × Purchase Frequency × Profit Margin × Customer Lifetime − CAC
Each component breaks down like this:
Average Order Value (AOV)
AOV = Last 12 Months’ Net Revenue ÷ Last 12 Months’ Total Orders
Pull your last 12 months’ net revenue and total orders from your ecommerce platform (Shopify, WooCommerce, or Magento… all three have this in standard reports).
Divide one by the other. That’s your AOV.
Purchase Frequency
Purchase Frequency = Last 12 Months’ Total Orders ÷ Last 12 Months’ Total Number of Customers
In Shopify, run the “Sales by Customer” report to see how many orders each customer placed, then calculate the average across all customers.
This number tells you how often a typical customer comes back. Most ecommerce brands are surprised by how low it is.
Average Profit Margin
Enter your average profit margin across all products as a decimal.
If you sell three products at 60%, 50%, and 40% margin, your average is 50%… so you enter 0.50.
Use net margin, not gross. Include all product costs, fulfillment, and returns.
Customer Lifetime
Churn Rate = Customers Lost in Last 12 Months ÷ Total Customers at Start of Period
Customer Lifetime = 1 ÷ Churn Rate
My strong recommendation: set Customer Lifetime to 1.
This keeps your CLV grounded in the last 12 months… what I call Linear CLV.
In today’s market, consumer behavior shifts fast enough that multi-year projections are more fiction than forecast.
A clean, repeatable 12-month number you can recalculate every month is far more useful.
Worked Example
Let’s say your store has these numbers over the last 12 months:
Net Revenue: $500,000 | Total Orders: 5,000 → AOV = $100
Total Orders: 5,000 | Total Customers: 2,500 → Purchase Frequency = 2.0
Average Profit Margin: 60% → 0.60
Customer Lifetime: 1 (Linear CLV — last 12 months)
CAC: $40
CLV = $100 × 2.0 × 0.60 × 1 − $40 = $80
This store generates $80 in net value per customer over 12 months, after subtracting acquisition costs.
That’s the number I take into the ratio.
How to Calculate Your CAC
The formula is simple. What goes into it is where most brands get it wrong.
CAC = Total Monthly Sales & Marketing Costs ÷ Total New Customers (Last 90 Days)
Your “Total Monthly Sales & Marketing Costs” must include all of the following:
- Hosting costs
- Social media team or agency fees
- Google Ads team or agency fees + ad spend
- SEO team or agency fees
- Development, design, CRO, and operations teams or agencies
- All other monthly ad spend (Meta, TikTok, Pinterest, etc.)
- Any other costs directly tied to running your website and acquiring customers
You don’t need to separate fixed from variable costs.
You’re a business owner, not an accountant. Add it all up.
As for the time window: I use the last 90 days for new customers… not 12 months.
It’s more responsive to recent changes in your acquisition efficiency, and it avoids the distortion of comparing a January marketing push to a December holiday surge.
Worked Example
Your total monthly sales and marketing costs over the last 90 days average $10,000/month. You acquired 250 new customers in that same period.
CAC = $10,000 ÷ 250 = $40 per new customer
Read my full article on CAC and our free CAC calculator to go deeper on this.
Calculating the CLV/CAC Ratio
Once you have both numbers, the ratio is a single division:
CLV/CAC Ratio = CLV ÷ CAC
Using our worked example from 2.1 and 2.2: CLV = $80, CAC = $40.
CLV/CAC Ratio = $80 ÷ $40 = 2.0
A ratio of 2.0 means for every dollar spent acquiring a customer, you’re getting two dollars back.
It’s a start… but not yet where you want to be.
The Payback Period: The Metric That Sits Next to Your Ratio
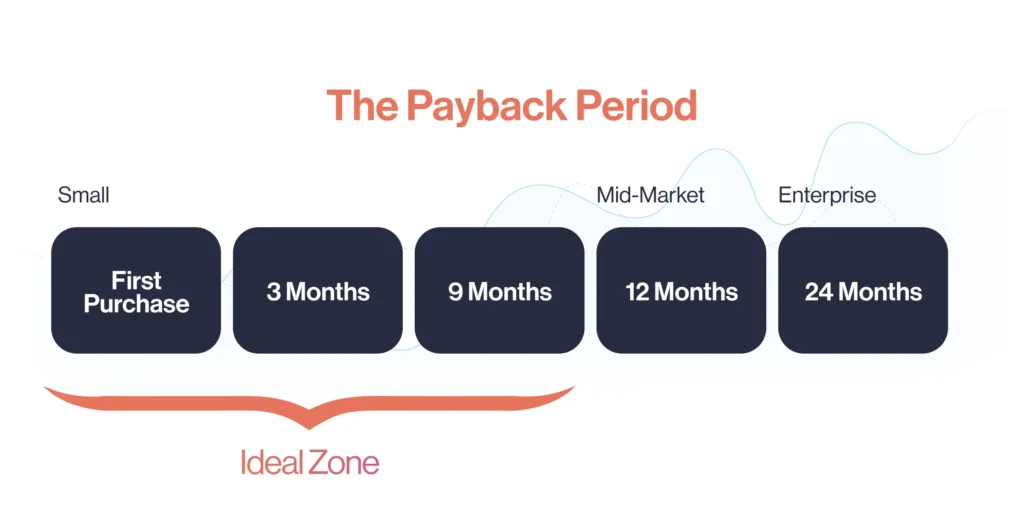
The CLV/CAC ratio tells you how much you get back. The Payback Period tells you how long it takes to get it back.
Both matter.
A great ratio with a 24-month payback period is a cash flow problem waiting to happen.
Payback Period (months) = CAC ÷ (AOV × Profit Margin)
Using our example: CAC = $40, AOV = $100, Profit Margin = 0.60.
Payback Period = $40 ÷ ($100 × 0.60) = $40 ÷ $60 = 0.67 months (~3 weeks)
In this case the store recovers its acquisition cost within the first purchase: an EXCELLENT position.
Most brands aren’t this lucky, though.
Here are general payback period benchmarks by business size:
- Very small (<20 employees): 9 to 12 months
- Small (20-100 employees): 12 to 14 months
- Mid-market (100-1,000 employees): 14 to 18 months
- Enterprise (>1,000 employees): 18 to 24 months
For most ecommerce brands, the goal is to recover your CAC within the customer’s first purchase or first few orders.
If your payback period is stretching past 12 months, you need to either raise AOV, improve margins, or reduce CAC… before you think about scaling.
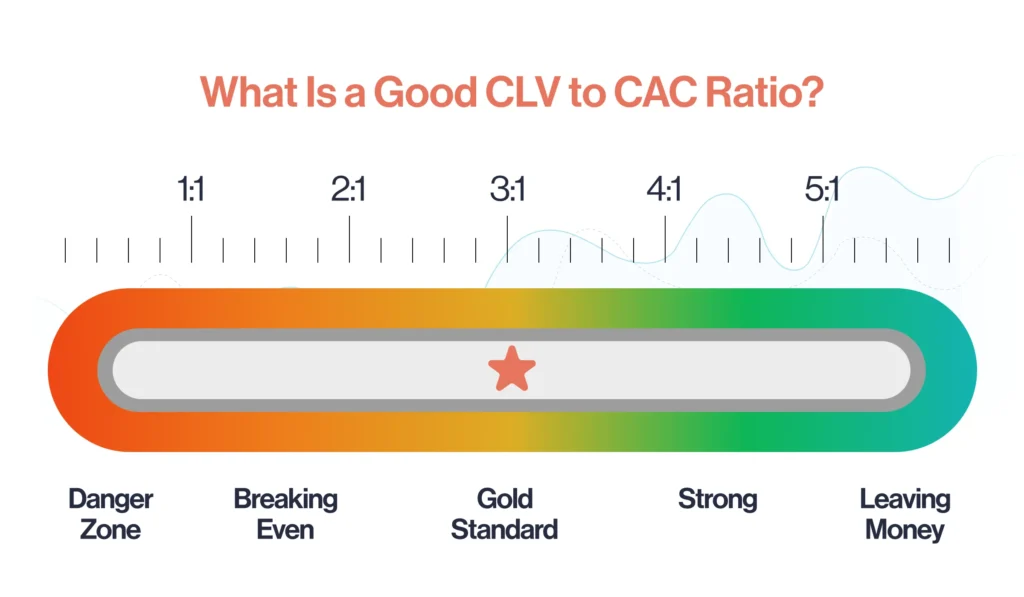
What Is a Good CLV to CAC Ratio?
Decoding the Numbers
Not all ratios are created equal.
Here’s how I read them… and how I explain them to every client I work with:
Below 1:1 – Danger zone
You’re losing money on every customer you acquire.
The faster you grow, the faster you bleed.
This was the women’s fashion brand from the introduction.
1:1 to 2:1 – Breaking even, at best.
You’re covering your acquisition cost, but there’s nothing left to reinvest, absorb overheads, or survive a slow month.
Not sustainable.
3:1 – The gold standard.
For every dollar you spend acquiring a customer, you get three back. This is the minimum healthy ratio for a business that wants to scale.
4:1 to 5:1 – Strong performance.
You’re running efficiently.
At this level, it’s worth asking whether you’re actually under-investing in growth.
Above 5:1 – Leaving money on the table.
Counter-intuitive, but true… a ratio this high usually means you could be acquiring more customers profitably and you’re not.
Time to reinvest.
My recommendation: set an alert in your KPIs dashboard for when the ratio drops below 3:1. That’s your signal to act: before the problem shows up in your bank account!
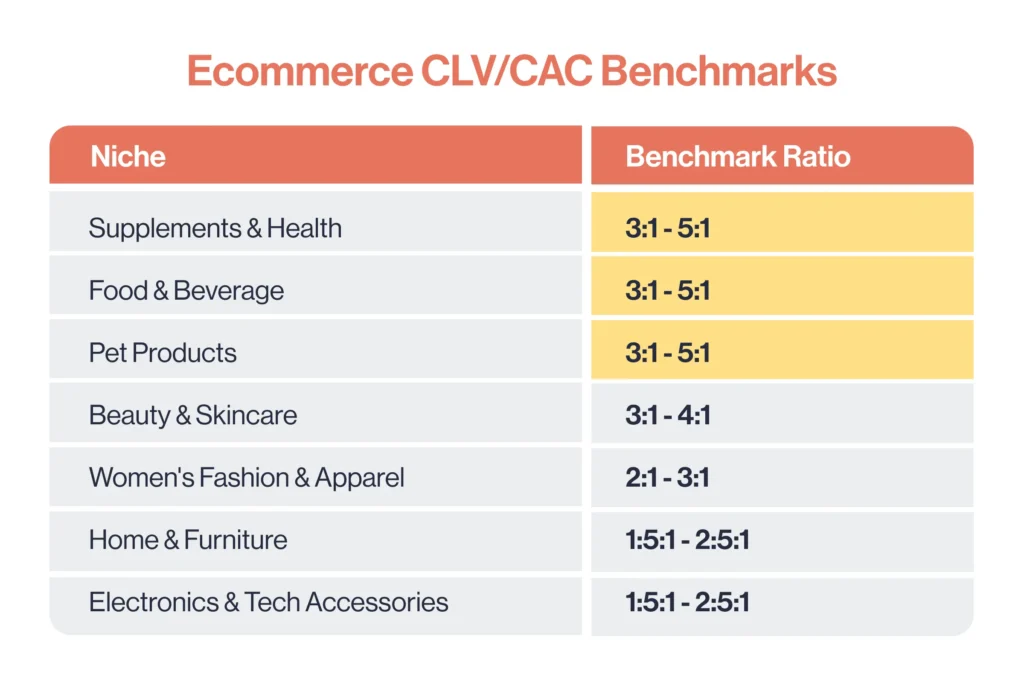
Ecommerce CLV/CAC Benchmarks: What I See by Niche
Not all ecommerce is the same.
A supplements brand and a women’s fashion brand can have completely different dynamics… even at the same revenue level. Here’s what I consistently see across the niches I work with:
Supplements & Health: 3:1 to 5:1
High repeat purchase frequency and strong subscription potential make this one of the best niches for CLV.
When the product works, customers come back for life.
Beauty & Skincare: 3:1 to 4:1
Loyal customers, strong UGC, and natural repurchase cycles keep CLV healthy.
The risk is over-reliance on influencer marketing, which can spike CAC fast.
Women’s Fashion & Apparel: 2:1 to 3:1
Trend-driven buying means lower repeat frequency and higher churn.
Brands that build a community or identity around the product push toward 3:1+.
Brands that don’t, struggle to stay above 2:1.
Pet Products: 3:1 to 5:1
Pet owners are fiercely loyal and spend consistently.
One of the highest CLV niches in ecommerce when retention is done right.
Food & Beverage (including subscriptions): 3:1 to 5:1
Subscription models and automatic replenishment make this a CLV powerhouse. Single-purchase food brands without a subscription component sit closer to 2:1.
Home & Furniture: 1.5:1 to 2.5:1
High AOV, but low purchase frequency and long buying cycles make CLV harder to grow. CAC tends to be high and payback periods long.
Electronics & Tech Accessories: 1.5:1 to 2.5:1
Price-sensitive buyers, high CAC from search competition, and low repeat rates.
This is the hardest niche to build a strong ratio in.
The niches with the best ratios share two things:
- a product people need to repurchase,
- and a brand strong enough to make them want to.
If you’re missing one of those, that’s where to start.
Why the CLV to CAC Ratio Is Critical for Business Decisions
Most ecommerce owners check their revenue numbers every day.
But the CLV/CAC ratio?
Many only look at it when something feels off… or never at all.
That’s a mistake.
Because this ratio doesn’t just tell you how you’re doing… it tells you what to do next.
Marketing Budget Allocation
Most brands allocate their marketing budget based on ROAS or last-click attribution.
And that’s one of the most expensive mistakes I see.
ROAS tells you how a campaign performed on a given day. It tells you nothing about whether the customers you acquired from that campaign are actually going to come back… or ever be profitable.
The CLV/CAC ratio by channel changes everything. When you know that your SEO customers have a 6:1 ratio and your Meta customers are at 1.8:1, the budget conversation becomes very clear.
One of the principles I share with every client is this:
“if everything is important, nothing is important”.
The CLV/CAC ratio by channel forces you to prioritize ruthlessly… and allocate accordingly.
Track it in your ecommerce KPIs Dashboard and review it every month.
Retention vs. Acquisition Strategy
There’s an ongoing debate in ecCommerce about whether to prioritize acquisition or retention.
The CLV/CAC ratio ends that debate.
It diagnoses which side of the equation needs work, so you stop guessing and start acting.
If your ratio is dropping because your CLV is falling: customers are churning faster, buying less, or not coming back after the first purchase.. then more acquisition spend isn’t the answer. Fix retention first.
On the other hand, if your ratio is sitting above 4:1 because your retention is excellent, but you’re growing slowly… that’s a signal to invest more aggressively in acquisition. You’ve earned it.
The ratio tells you which problem you actually have.
Product Pricing & Packaging Decisions
Pricing decisions are rarely made with CLV in mind… and that’s a missed opportunity.
Every time you change a price, launch a promotion, or restructure your product line, you’re potentially reshaping the long-term value of every customer you acquire.
A 15% discount campaign might increase your conversion rate and bring in more customers on paper… but if those customers were primarily attracted by the discount, they’re less likely to come back at full price.
Your CLV drops.
Your ratio drops.
And you might not see it for months.
The fix is to always model the CLV impact of pricing decisions before you implement them.
Ask: does this bring in customers who will buy again, at margin? Or does it attract one-time buyers who inflate my revenue this month and hurt my ratio next quarter?
Your ecommerce KPIs Dashboard should make this visible every single month.
Scaling Decisions
This is where the CLV/CAC ratio becomes the most important number in the room.
Every scaling decision (doubling your ad budget, hiring a growth team, opening a new channel) should be gated behind one question: is my ratio above 3:1?
If yes… scale. Every dollar you add will compound profitably.
If no… scaling multiplies your losses, not your profits.
I’ve seen this play out too many times: a brand gets excited about a good month, doubles their ad budget, and three months later they’re wondering why profitability has collapsed.
The ratio was telling them to fix the fundamentals first.
They didn’t listen.
My rule: recalculate your ratio before every major spending decision.
Treat it like a checkpoint on a 90-day roadmap.
Green light at 3:1+.
Red light below that.
How to Improve Your CLV to CAC Ratio
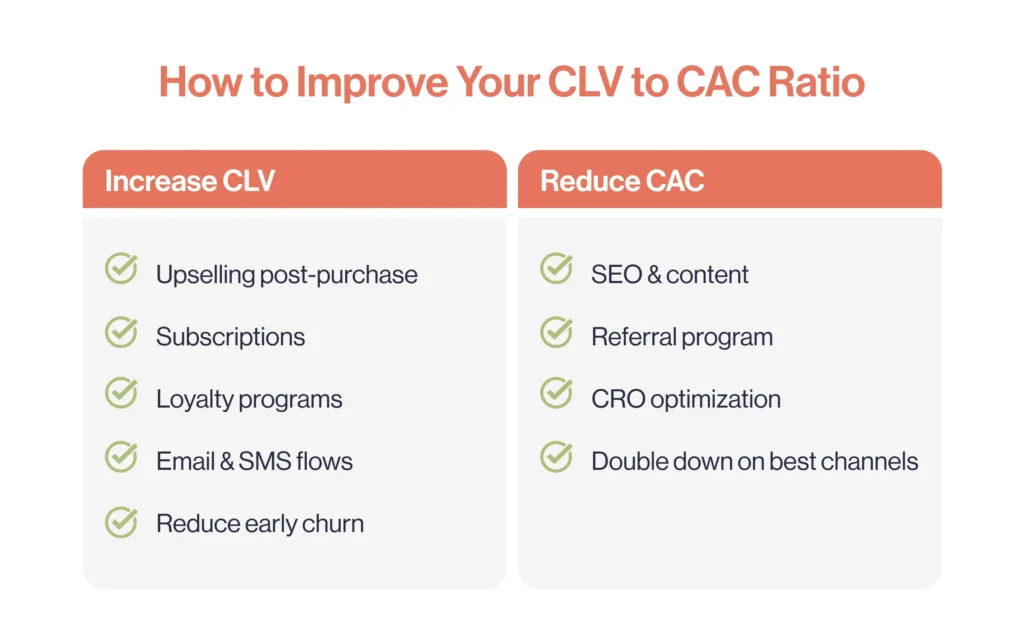
You can improve your CLV/CAC ratio from two directions: push CLV higher, or pull CAC lower.
The best brands do both at the same time.
Here’s how.
Strategies to Increase CLV
CLV grows when customers buy more, buy more often, or stay longer.
Every lever you pull here shows up directly in your ratio.
Upselling and Cross-Selling at the Right Moment
The post-purchase moment is one of the most underused opportunities in ecommerce.
A customer who just bought from you is more engaged than they’ll ever be again.
That’s the moment to present a complementary product, an upgrade, or a bundle… not six weeks later in a re-engagement email.
Done right, post-purchase upsells increase AOV on the second order, improve purchase frequency, and lift CLV… all without adding a cent to your CAC.
Subscription and Membership Models
Nothing extends Customer Lifetime like recurring revenue.
If your product category allows it (consumables, supplements, beauty, pet products, apparel basics) a subscription model is one of the highest-leverage CLV improvements available.
Even a simple “subscribe and save” option can dramatically increase Purchase Frequency and reduce churn.
The customer acquired once… keeps paying month after month.
Loyalty Programs and Post-Purchase Engagement
A loyalty program done well increases purchase frequency, increases AOV (customers spend more to hit reward thresholds), and creates a psychological switching cost that reduces churn.
The key word is done well.
A loyalty program that rewards every purchase equally with no strategic intent is just a discount program with extra steps.
Structure rewards around behaviors that actually increase CLV: second purchases, high-AOV orders, referrals, subscription sign-ups.
Email and SMS Retention Flows
Email and SMS marketing are the highest-ROI tools available for CLV improvement… because the cost per send is near zero once you have the list.
Platforms like Klaviyo let you build automated flows that trigger based on purchase history, time since last order, and predicted churn risk.
A well-built win-back sequence alone can recover 10–15% of customers who would otherwise be lost.
If you’re not running post-purchase, replenishment, and win-back flows… you’re leaving CLV on the table every single month.
Reducing Early Churn
The most expensive churn is early churn: customers who buy once and never return.
This often points to a gap between what your marketing promised and what your product delivered. Or a weak onboarding experience. Or a first purchase that didn’t include a clear reason to come back.
Audit your first-to-second purchase conversion rate.
If it’s below 20%, that’s where I’d focus first.
Strategies to Reduce CAC
You can’t cut your way to a great CLV/CAC ratio… but you can absolutely optimize your acquisition costs.
Here’s where I see the biggest opportunities:
Invest in SEO and Content Marketing
Organic traffic is the lowest-CAC acquisition channel available to most ecommerce brands… and the one most brands underinvest in.
A well-ranked product or category page brings in purchase-intent traffic at near-zero marginal cost. The initial investment pays back over years, not months.
If you’re spending heavily on paid acquisition and doing nothing on SEO, you’re rebuilding the same customer pool from scratch every month.
Run an Ecommerce SEO Audit, and track your SEO-to-acquisition contribution in your Ecommerce KPIs Dashboard.
Build a Referral Program
Referral-acquired customers almost always have a lower CAC than paid-acquired customers… and a higher CLV.
They came in with social proof already built in. They trust the brand because someone they trust referred them.
A double-sided referral program (reward the referrer and the new customer) converts better and acquires at a fraction of your paid CAC. If you’re not running one, start there.
Optimize Conversion Rate Before Scaling Spend
This is one I can’t say enough.
If your store converts at 1.5% and you spend $10,000/month on ads, improving conversion to 2.5% gives you 40% more customers from the same spend… with no increase in CAC.
CRO is the most underrated lever in the entire CLV/CAC equation.
Fix the funnel before you pour more traffic into it.
Double Down on Your Best Channels
Once you calculate CLV/CAC by channel, you’ll almost always find that one or two channels are dramatically outperforming the rest.
Double down on those.
Cut the underperformers.
Reallocate the budget.
It sounds simple because it is… but most brands never do it because they don’t have the channel-level data to make the call.
Channel-by-Channel CLV/CAC Comparison
Your blended CLV/CAC ratio is useful.
Your per-channel CLV/CAC ratio is transformative.
Here’s why: two channels can look identical on ROAS and completely different on CLV/CAC.
The channel with the lower ROAS might be acquiring higher-quality, longer-retaining customers.
You’d never know without the ratio.
To calculate CLV/CAC per channel, tag your customers by acquisition source (UTM parameters + Shopify customer data) and track their subsequent purchase behavior by cohort.
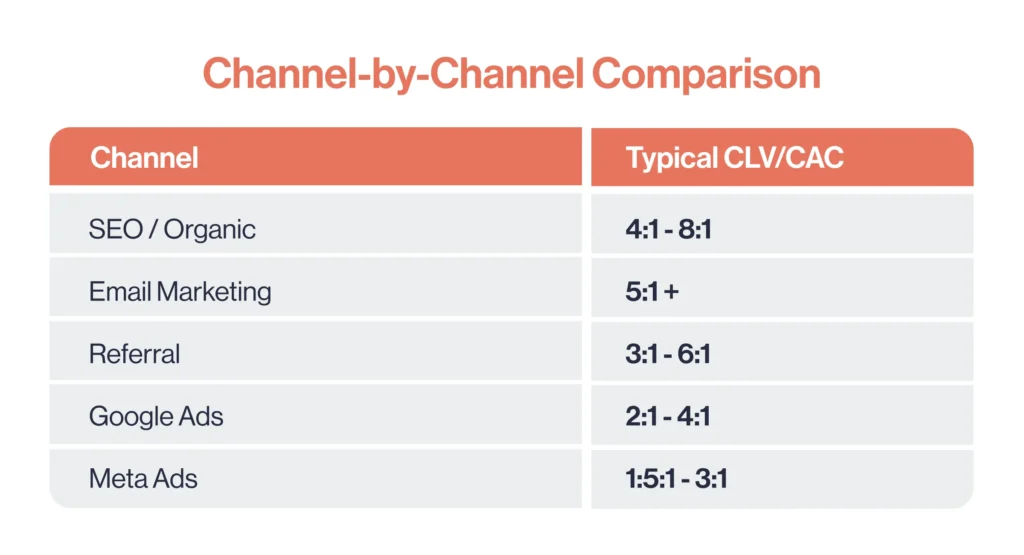
Here are typical channel ranges I see across ecommerce clients:
SEO / Organic Search:
Typically 4:1–8:1.
High CLV, near-zero marginal CAC once content is ranking.
Slowest to build, highest long-term return.
Email Marketing:
Often 5:1+ for retention-focused flows.
Not a pure acquisition channel, but it dramatically extends CLV for customers already acquired.
Referral:
3:1–6:1 depending on incentive structure.
Referred customers typically have higher purchase frequency and lower churn.
Meta Ads (Facebook/Instagram):
1.5:1–3:1 for most ecommerce brands.
High CAC in competitive verticals.
Works best when CLV is strong enough to absorb the cost.
Google Ads (Search + Shopping):
2:1–4:1.
Typically brings in higher-intent buyers than social, which translates to better CLV.
Advanced Tactics for 2026
The fundamentals above will move the needle for most brands.
But if you’re operating at a more advanced level, here’s what’s actually changing the game in 2026:
AI-Driven Customer Segmentation
Not all customers are created equal.. and AI tools can now identify your highest-CLV customer profile with remarkable precision.
Platforms like Klaviyo, Triple Whale, and Northbeam can segment your customer base by predicted lifetime value, letting you build lookalike audiences on Meta and Google that target the customers most likely to buy again.
The result: lower CAC on the front end, higher CLV on the back end.
The ratio improves from both sides.
Predictive CLV Modeling
Shopify and Klaviyo now offer predictive CLV scoring: identifying which customers are likely to be high-value before they’ve had the chance to prove it.
This lets you invest more heavily in retaining those customers early, before churn risk sets in.
It’s a shift from reactive retention (win-back campaigns) to proactive retention (nurturing high-CLV customers from day one).
First-Party Data Strategy
With third-party cookies gone and ad platforms getting noisier, the brands winning in 2026 are the ones who own their customer data.
That means email lists, SMS subscribers, loyalty program members, and zero-party data collected directly from customers.
First-party data lowers your paid CAC (you’re not constantly renting audiences from Meta and Google) and extends CLV (you can reach customers directly, at near-zero cost, forever).
Monthly Dashboard Reviews as a Non-Negotiable
Advanced brands don’t guess at their ratio — they track it monthly in a structured dashboard with goals, actuals, and year-over-year comparisons.
If you don’t have that infrastructure yet, this is where I’d start.
Build your Ecommerce KPIs Dashboard, set your 3:1 alert, and make monthly review a non-negotiable part of how you run your business.
Common Mistakes When Measuring CLV/CAC
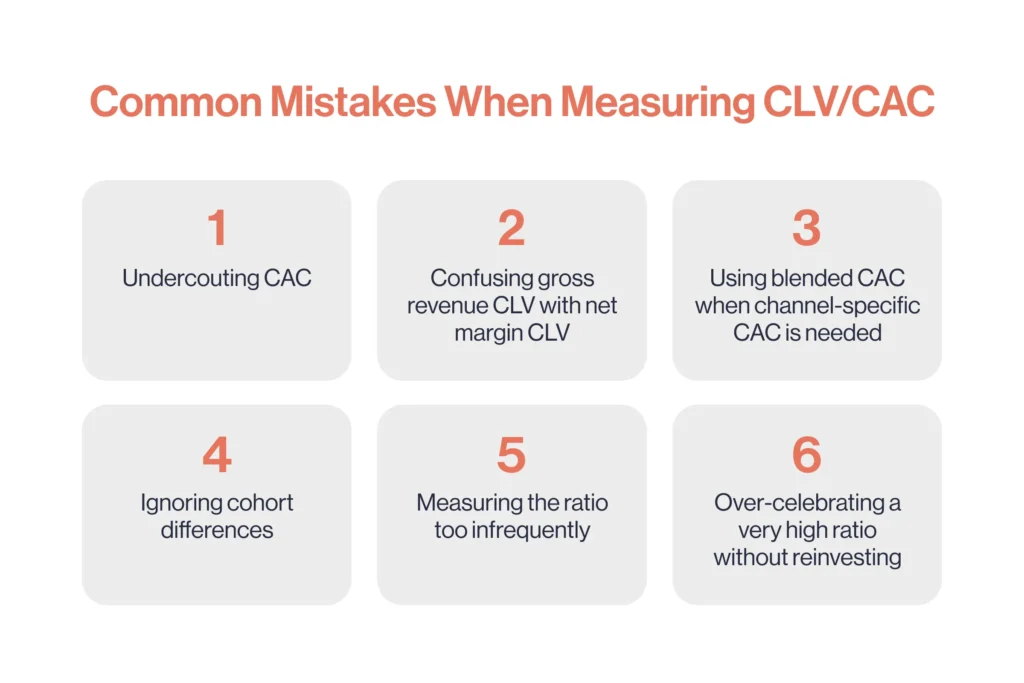
I’ve reviewed the numbers for hundreds of ecommerce brands over the years.
The same mistakes come up again and again. Here are the ones that cost brands the most:
Undercouting CAC
Only including ad spend and ignoring salaries, tools, agency fees, and overhead.
Your real CAC is almost always higher than you think.
Confusing gross revenue CLV with net margin CLV
CLV calculated on gross revenue looks great on paper.
CLV on net margin tells you what you actually keep. Always use net.
Using blended CAC when channel-specific CAC is needed
Blended CAC hides underperforming channels.
If you’re not calculating CAC by source, you’re flying blind on budget allocation.
Ignoring cohort differences
Customers acquired three years ago behave differently from customers acquired last quarter. Averaging them together distorts your CLV. Build cohort-specific views.
Measuring the ratio too infrequently
Quarterly or annual checks aren’t enough.
The CLV/CAC ratio is a monthly metric.
Treat it that way.
Over-celebrating a very high ratio without reinvesting
A 6:1 or 7:1 ratio sounds great… but it usually means you’re under-investing in acquisition and leaving growth on the table. The ratio should push you toward action, not complacency.
How to Track CLV/CAC in 2026
Calculating your CLV/CAC ratio once is a start.
Tracking it consistently (with the right tools, the right cadence, and the right dashboard) is what actually moves the business.
Here’s exactly how I set this up for the brands I work with.
Your Data Sources
Every number in your CLV/CAC calculation comes from a real platform.
Here’s where to pull each one:
Net Revenue & Total Orders:
Shopify, WooCommerce, or Magento… standard reports in all three.
Purchase Frequency per Customer:
Shopify’s “Sales by Customer” report.
Export to Google Sheets and calculate average orders per customer.
Paid Ad Costs:
Meta Ads Manager, Google Ads account… pull spend by date range.
New Customer Count:
Your ecommerce platform filtered to first-time buyers.
GA4 can also provide this via the “new users” metric with ecommerce tracking enabled.
Email & SMS Revenue:
Klaviyo, Mailchimp, Attentive… channel revenue report.
SEO Performance:
Google Search Console… clicks, impressions, branded vs. non-branded split.
What to Put in Your Dashboard
One of the most important lessons from 25+ years of working with ecommerce brands: when everything is visible, everything is actionable.
The metrics your dashboard should surface every month:
Total Revenue (current month vs. same month last year)
CAC (last 90 days, vs. last quarter)
CLV (last 12 months, vs. same period last year)
CLV/CAC Ratio (with a red indicator if it drops below 3:1)
Paid Ads: ROAS, Ads CAC, % of total revenue by channel
Email Marketing: Open rate, click rate, % of total revenue
SEO: % clicks vs. prior year, % impressions vs. prior year, % non-branded clicks
Goals and actuals side-by-side for each metric… so you can see at a glance if you’re on track or not.
The critical design principle: no charts, no graphics… numbers and comparisons only.
Graphics look nice but hide the story.
Numbers force clarity.
See exactly how I build this in the ecommerce KPIs Dashboard guide.
Recommended Tracking Cadence
Different decisions need different cadences.
Here’s the structure I recommend:
Monthly:
– Recalculate CLV (last 12 months) and CAC (last 90 days).
– Update your KPIs Dashboard.
– Compare current month vs. same month last year (not vs. prior month).
– Check ratio against your 3:1 alert.
Quarterly:
– Deep-dive by channel.
– Compare CLV/CAC ratios per acquisition source and identify where to shift budget.
– Review payback period by channel.
– Adjust strategy accordingly.
Annually:
– Full strategic review.
– Compare this year’s ratio trend against the prior year.
– Assess whether your CLV improvement initiatives are actually working.
– Set new targets for the year ahead.
Remember: always compare the current month vs. the same month in the prior year… never just the prior month (seasonality will distort everything otherwise).
The ecommerce KPIs Dashboard is built around exactly this cadence.
CLV to CAC Ratio — FAQs
What is a good CLV to CAC ratio?
For ecommerce, a healthy CLV/CAC ratio is at least 3:1.
That means for every $1 you spend acquiring a customer, you’re getting $3 back in net value over 12 months.
Below 3:1? Your unit economics need attention before you scale. Above 5:1? You’re probably under-investing in growth.
Set an alert in your dashboard for the moment it drops below 3:1. That’s your early warning signal.
Can a CLV/CAC ratio be too high?
Yes… and this surprises a lot of people.
A ratio above 5:1 can actually indicate that you’re under-investing in acquisition. You have a highly profitable customer base… but you’re not growing it as fast as you could.
If your ratio is consistently above 5:1, that’s a signal to reinvest: increase your acquisition budget, test new channels, or expand into new markets.
What’s the difference between CLV and LTV?
Nothing.
CLV (Customer Lifetime Value) and LTV (Lifetime Value) refer to the exact same concept.
The terms are used interchangeably depending on the platform, tool, or industry.
You’ll see both… they mean the same thing.
How often should I recalculate my CLV/CAC ratio?
Every month, without exception.
The CLV/CAC ratio is not an annual audit… it’s a monthly health check.
Markets shift, acquisition costs change, and retention patterns evolve.
A ratio that looked healthy in Q1 can deteriorate significantly by Q3 if you’re not watching.
Build it into your Ecommerce KPIs Dashboard so it updates automatically every month.
Does CLV/CAC apply to B2B businesses?
Yes, of course!! And in many ways it’s even more critical in B2B.
Deal sizes are larger, sales cycles are longer, and the cost of losing a client is much higher than in B2C.
The formula is the same… but the inputs look different. CAC includes sales team costs, demos, and longer nurture cycles. CLV is driven by contract value and renewal rates.
The 3:1 benchmark applies here too. In enterprise B2B, 4:1+ is the target.
How do I calculate CLV/CAC per marketing channel?
Tag each customer with their acquisition source using UTM parameters in GA4, and ensure your ecommerce platform is connected to track subsequent purchase behavior by source.
Then calculate CLV and CAC separately for each channel cohort. The difference between channels is almost always larger than brands expect.
What’s the difference between blended CAC and paid CAC?
Blended CAC divides your total marketing and sales costs by all new customers acquired (across every channel). It’s your true cost of acquisition as a business.
Paid CAC only counts the cost of paid channels (Meta, Google, TikTok, etc.) against the customers those channels directly attributed.
Use blended CAC for financial planning and CLV/CAC ratio calculations.
Use paid CAC to evaluate the efficiency of individual ad campaigns.
Confusing the two leads to bad decisions in both directions.
My ratio dropped below 3:1. What should I do first?
First, diagnose which side of the equation changed.
Did CLV drop? (Customers buying less, churning faster, lower AOV?)
Then the problem is retention. More acquisition spend will make it worse.
Did CAC rise? (Ad costs up, conversion rate down, new channels underperforming?)
Then the problem is acquisition efficiency. Pause or reallocate spend before scaling further.
Once you know which side moved, fix the bigger driver first.
And don’t scale again until the ratio is back above 3:1.
—————
The CLV to CAC ratio is the simplest way to answer the most important question in ecommerce: Is the customer worth more than it costs to acquire them?
Everything else (ROAS, revenue growth, conversion rates) is noise until you can answer that question with confidence.
Please, leave your questions below!